
Late-Stage Trial Costs: Beyond Total Costs

Late-Stage Clinical Trial Costs Across Therapeutic Areas
Clinical trials represent a major component of pharmaceutical development costs, particularly during late stage development. However, trial economics can differ considerably across therapeutic areas and depending on whether costs are considered at the level of the overall trial or the individual participating subject.
To explore these differences on a high level, we analyzed cost data from completed Phase II/III and Phase III clinical trials across 21 therapeutic areas, comparing trial representation, median total trial cost and median cost per subject. The analysis includes only trials for which cost data were available and therefore reflects the cost available subset of the database rather than all late-stage clinical trials.
Trial representation is concentrated in a limited number of therapeutic areas
The distribution of trials included in the analysis varied considerably across therapeutic areas. Infectious Diseases and Diseases of the Central Nervous System represented the largest categories, together accounting for around 30% of included trials, followed by Oncology and Metabolic Disorders.
More than half of the analyzed trials were concentrated across five therapeutic areas: Infectious Diseases, Central Nervous System, Oncology, Metabolic Disorders and Respiratory Disease. The ten most represented therapeutic areas accounted for approximately 82% of included trials.
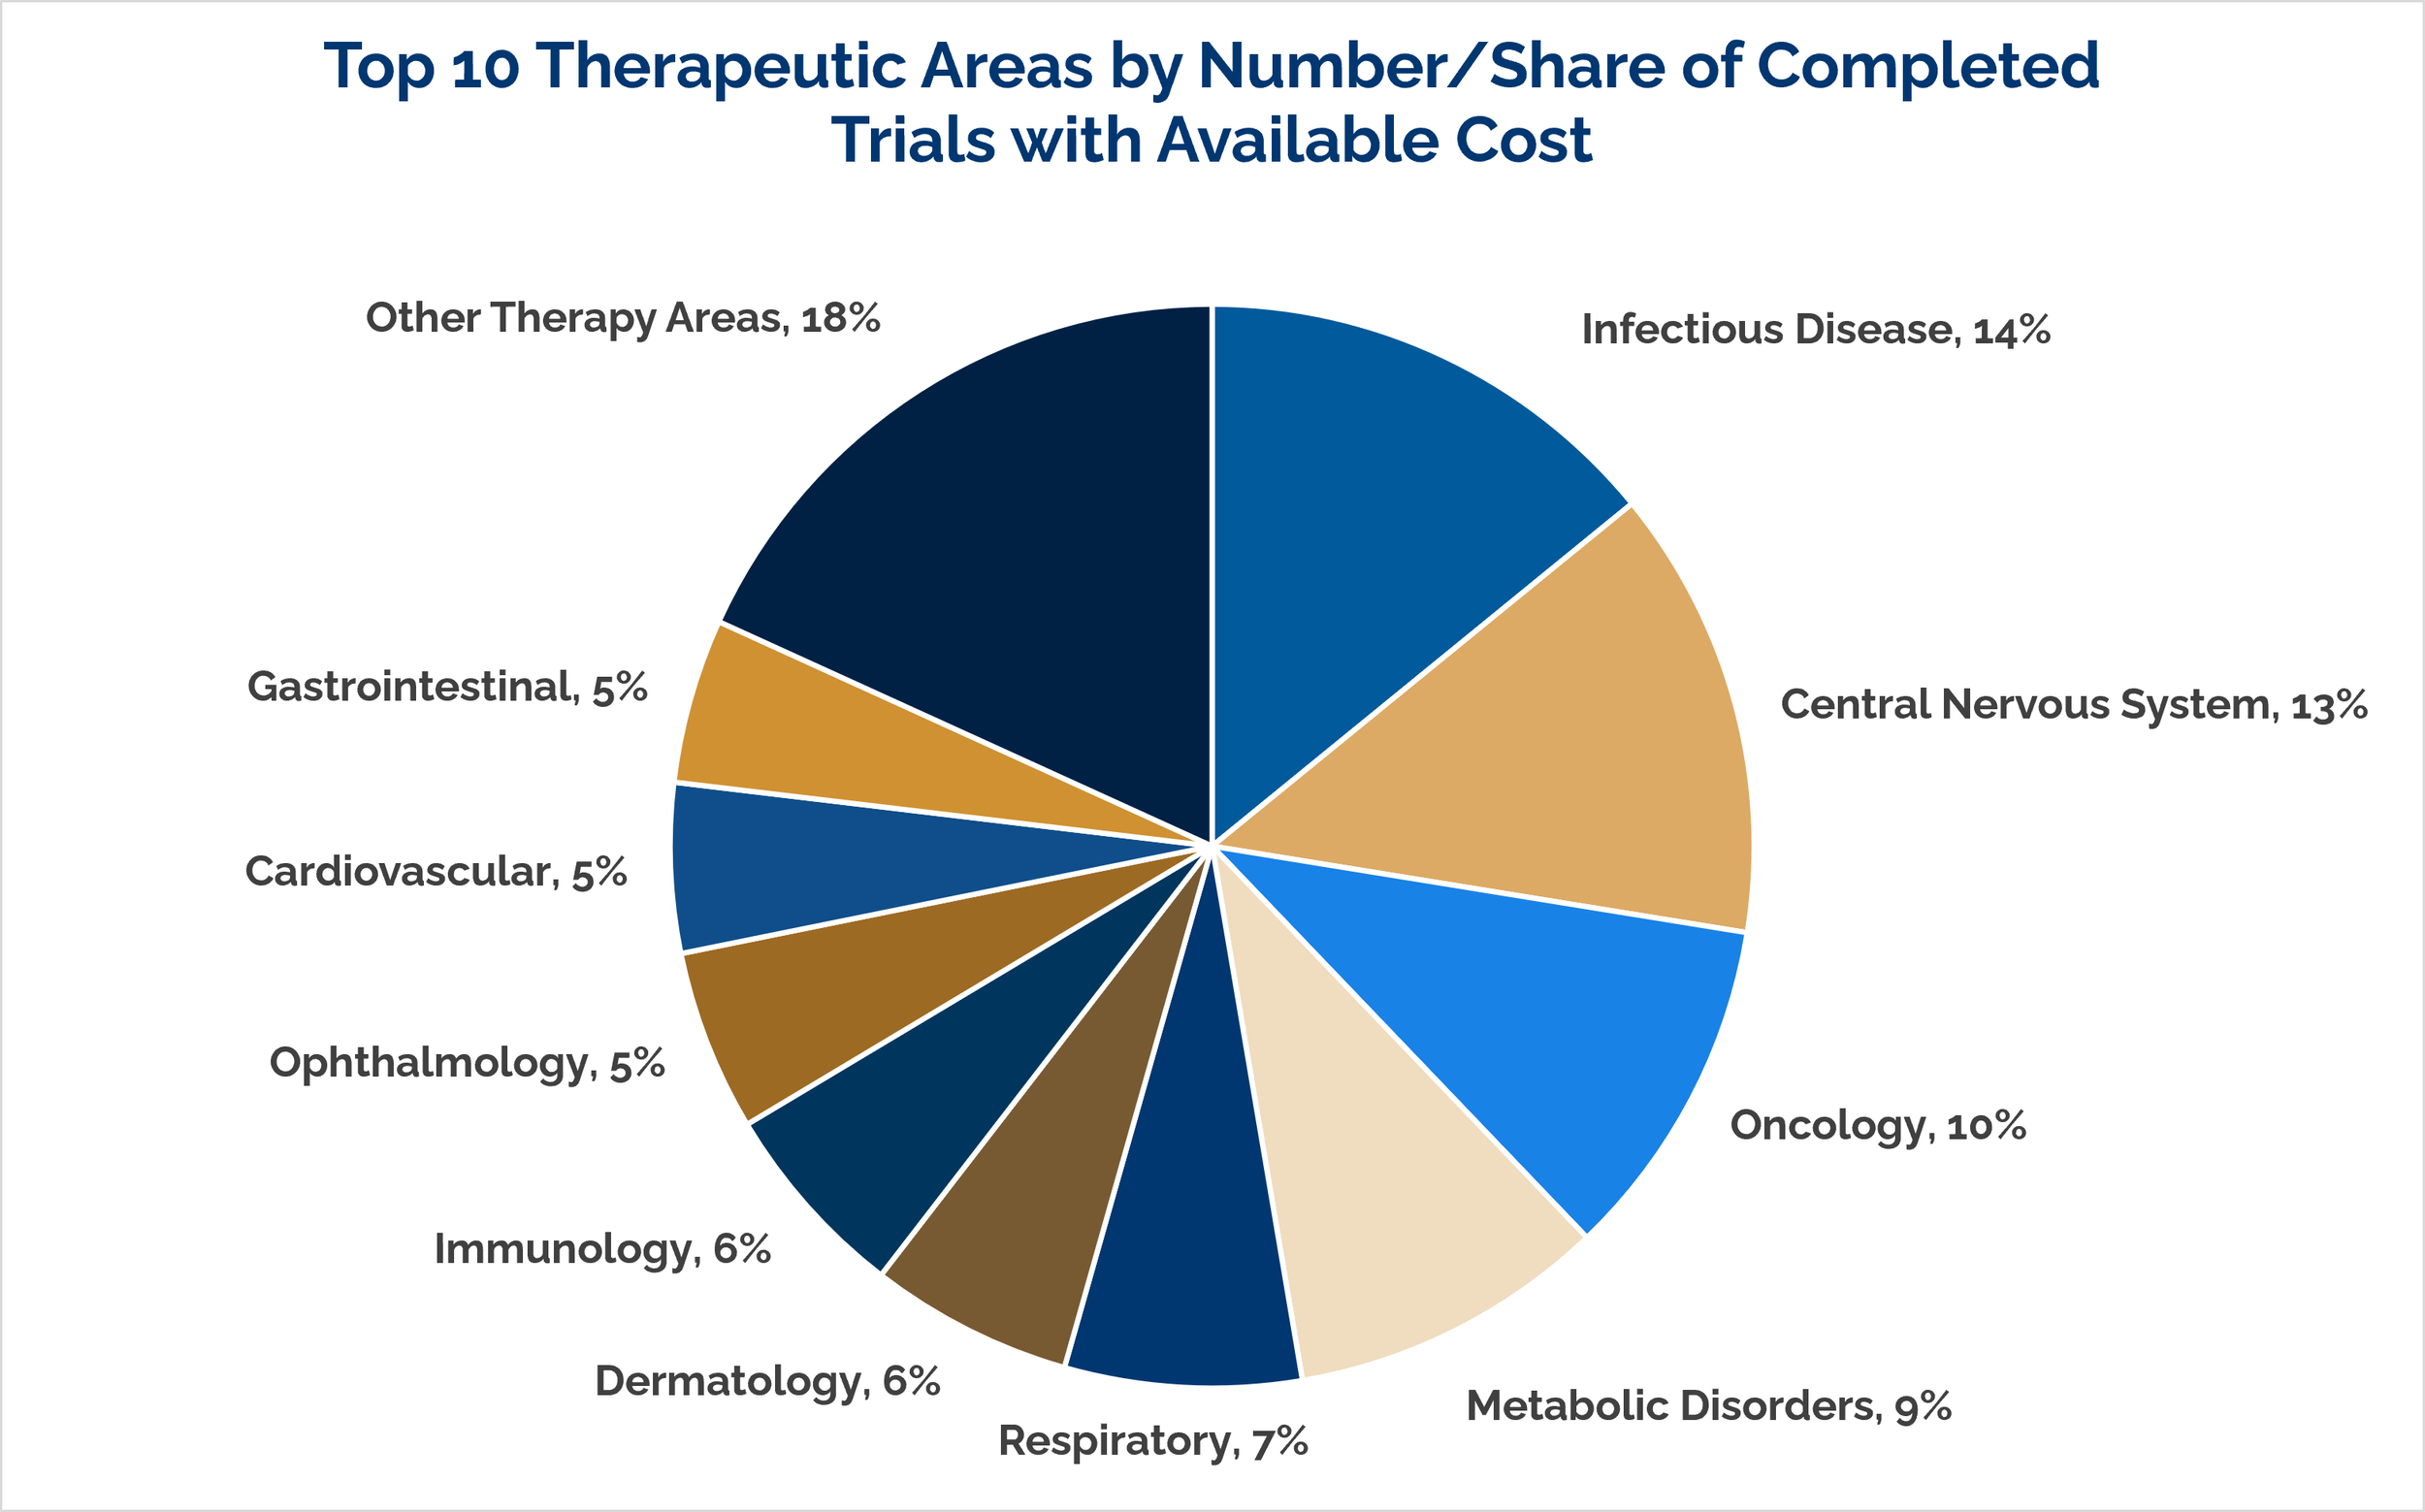
Trial representation provides one perspective on the late stage development landscape. Ranking therapeutic areas by median total trial cost, however, highlights a different set of therapeutic areas.
Median total trial cost shifts the therapeutic area ranking
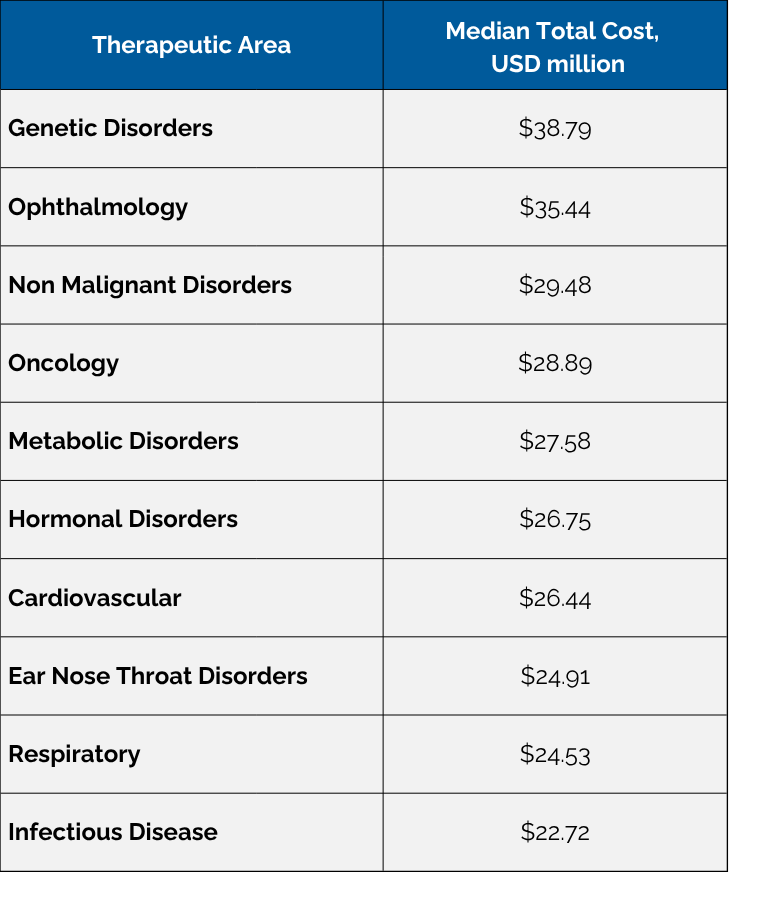
When therapeutic areas are ranked according to median total trial cost, Genetic Disorders showed the highest value in the dataset at approximately $39 million, despite accounting for only around 1% of analyzed trials. Ophthalmology followed at approximately $35 million, while representing a considerably larger share of around 5%.
Oncology, one of the most represented therapeutic areas in the analysis, also ranked relatively high, with a median total trial cost of approximately $29 million.
Cost per subject provides a different perspective
A further shift becomes apparent when costs are considered at the subject level.
Genetic Disorders again showed the highest median, at approximately $320,000 per subject, followed by Hormonal Disorders at approximately $250,000 and Hematological Disorders at approximately $180,000.
In contrast, some therapeutic areas associated with comparatively high total trial costs showed substantially lower costs per subject. Oncology, for example, had a median total trial cost of approximately $29 million but a median cost per subject of approximately $80,000. Infectious Disease provides another notable contrast. While it represented the largest share of trials in the dataset and ranked 10th in median total trial cost, it had the lowest median cost per subject of all 21 therapeutic areas, at approximately $40,000.
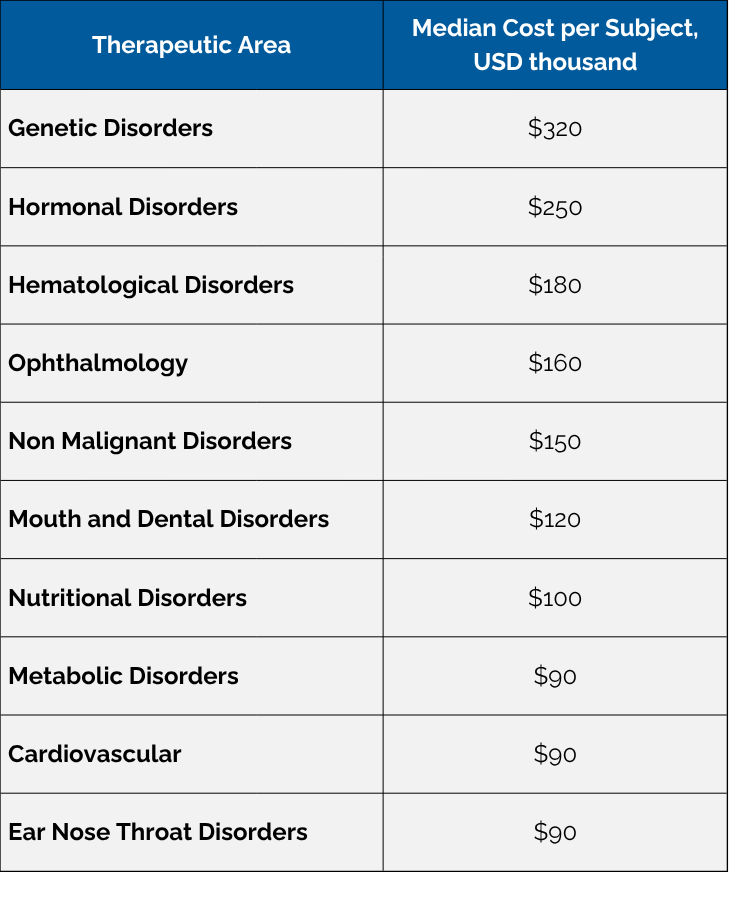
Taken together, the two rankings illustrate that high total trial cost and high cost per subject are not interchangeable measures of late-stage trial economics.
Mean and median costs can tell different stories
While median values provide a useful basis for comparing therapeutic areas, differences between mean and median costs offer additional insight into the distribution of observed costs.
Across most therapeutic areas, mean costs exceeded median costs, suggesting that higher cost observations pull the average upwards. This difference was particularly pronounced for cost per subject.
In Gastrointestinal Disorders, for example, the mean cost per subject was approximately 3.4 times the median. Metabolic and Cardiovascular Disorders showed mean to median ratios of around 2.9, while the corresponding ratio for Infectious Diseases was approximately 2.5. For total trial cost, the differences were generally less pronounced. Gastrointestinal Disorders, for example, showed a mean to median ratio of approximately 1.4. This demonstrates that the influence of higher cost observations can differ substantially depending on whether overall trial cost or cost per subject is considered.
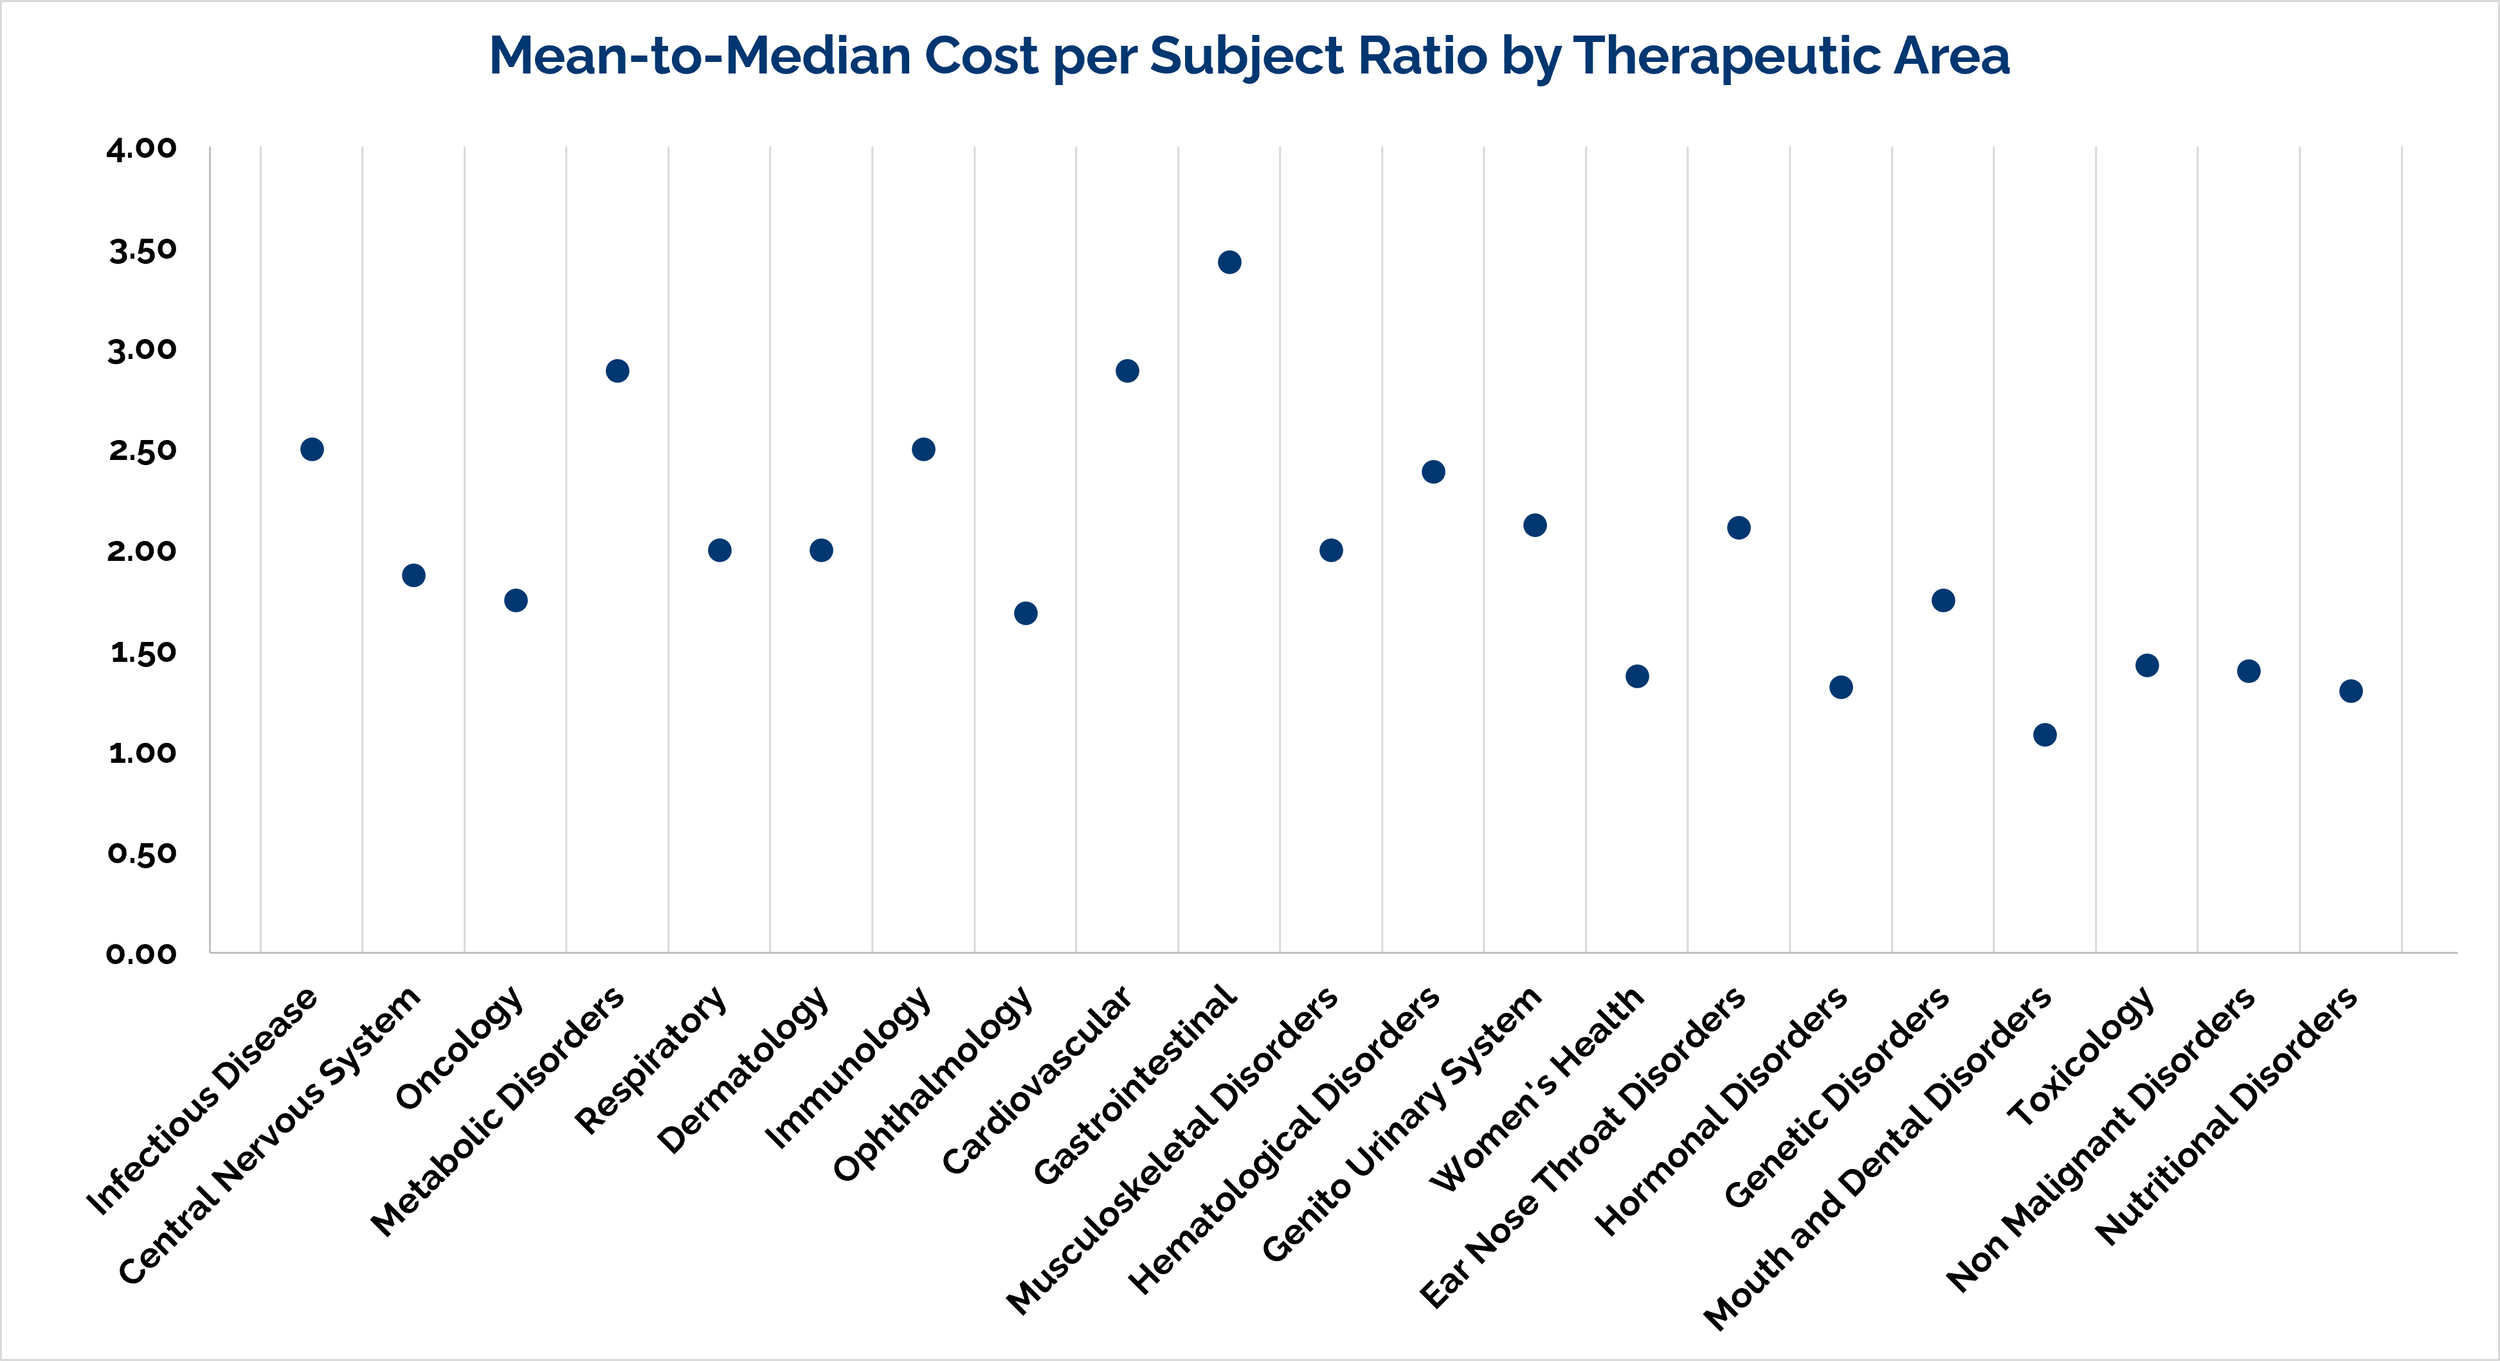
These differences also explain why median values were used as the primary metric for our therapeutic area comparisons. Particularly where individual high-cost observations influence the average, the median is less sensitive to extreme values and may provide a more representative indication of the typical cost observed within a therapeutic area.

Our analysis shows that therapeutic areas can occupy very different positions depending on the cost perspective considered.
The therapeutic areas used in this analysis represent broad database classifications and encompass heterogeneous indications, treatment modalities, patient populations and study designs. The results should therefore be interpreted as a broad view of late-stage trial economics rather than as cost estimates for individual indications or development programs.
Nevertheless, they provide an initial indication of the considerable differences both between and within therapeutic areas.
From broad benchmarks to individual development programs
Broad therapeutic area comparisons provide useful context, but meaningful clinical trial cost benchmarking ultimately requires greater granularity. Trial design, indication, patient population, geographic scope, duration and characteristics specific to the individual development program can all influence its cost profile.
At BSV, we analyze clinical trial costs at a more granular level to develop tailored benchmarks for development planning and asset valuation. Please get in touch with us if you would like to discuss how clinical development cost benchmarking could support your program or valuation.
Methodology: Analysis based on cost data for Phase II/III and Phase III clinical trials initiated and completed within the last 10 years. Only trials with available cost data were included, resulting in 8,159 trials across 21 therapeutic areas. Costs are presented in USD.